TimeWeave-Unified Timeline Analysis.
TimeWeave is a visual timeline analysis tool designed to help you understand time‑based data by weaving multiple sources into a single, clear, interactive timeline.
It is built to be flexible and approachable. Whether you are analysing digital‑forensic artefacts, system activity logs, spreadsheets, or financial records, TimeWeave focuses on one core idea:
Bring many dates, from many files, together into one unified timeline so patterns, clusters, and anomalies become easy to see.
You do not need to be technical to use TimeWeave. Most actions are point‑and‑click, with visual feedback at every step.
Histogram Overview
What the Histogram Shows
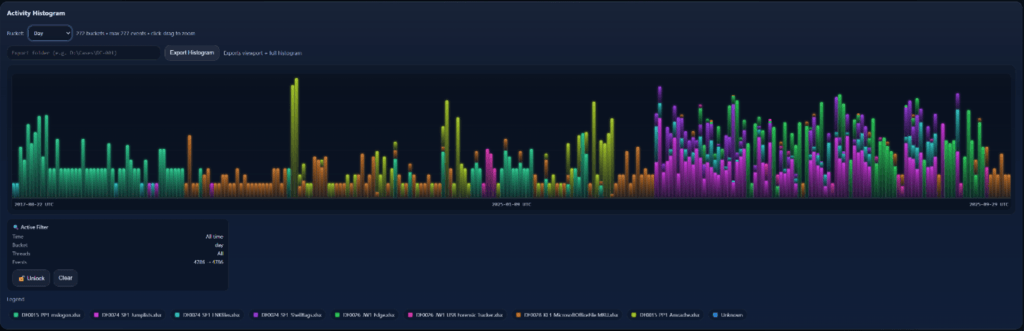
The histogram provides a high‑level overview of activity density over time.
Each bar represents:
- A time bucket
- The number of events in that period
Stacked View
When multiple threads are active, histogram bars are stacked by thread colour.
This allows you to quickly see:
- Which source dominates a time period
- Overlaps between datasets

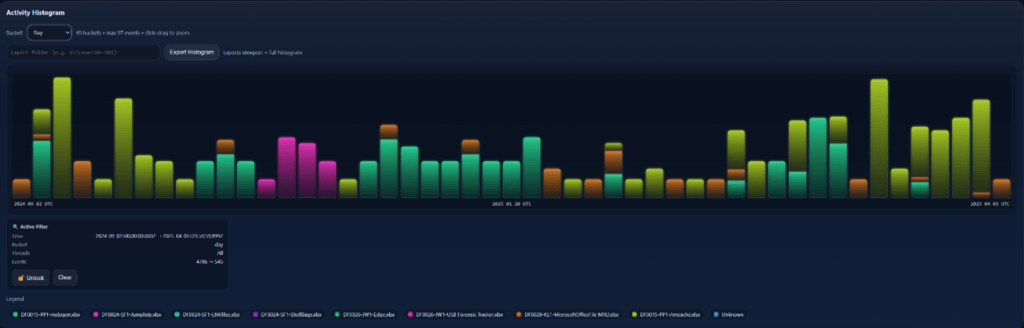
Stacked View by Event Type (Single Thread)
When only one thread is loaded, TimeWeave can switch the histogram into a different stacked mode.
Instead of stacking by thread, the histogram can be stacked by event type within that single dataset.
In this mode:
- Each colour segment represents a different timestamp or event type (for example: Created, Modified, Accessed)
- The total height of the bar still represents overall activity
- The internal stack shows what kind of events contributed to that activity
This is especially useful when analysing datasets that contain multiple timestamps per record, such as:
- File system artefacts
- Log entries with several date fields
- Financial or transactional records with multiple lifecycle dates
Stacking by event type allows you to:
Identify unusual patterns (for example, many modifications without corresponding creations)
See which timestamp type dominates certain periods
Compare lifecycle behaviour over time
Zooming with the Histogram
You can:
- Click and drag across the histogram
- Zoom the timeline to a specific time range
This is useful for focusing on periods of interest.

Filtering & Focus
Thread Filtering
Each thread can be:
- Enabled or disabled
- Highlighted via legend interaction
This helps reduce noise when working with many datasets.